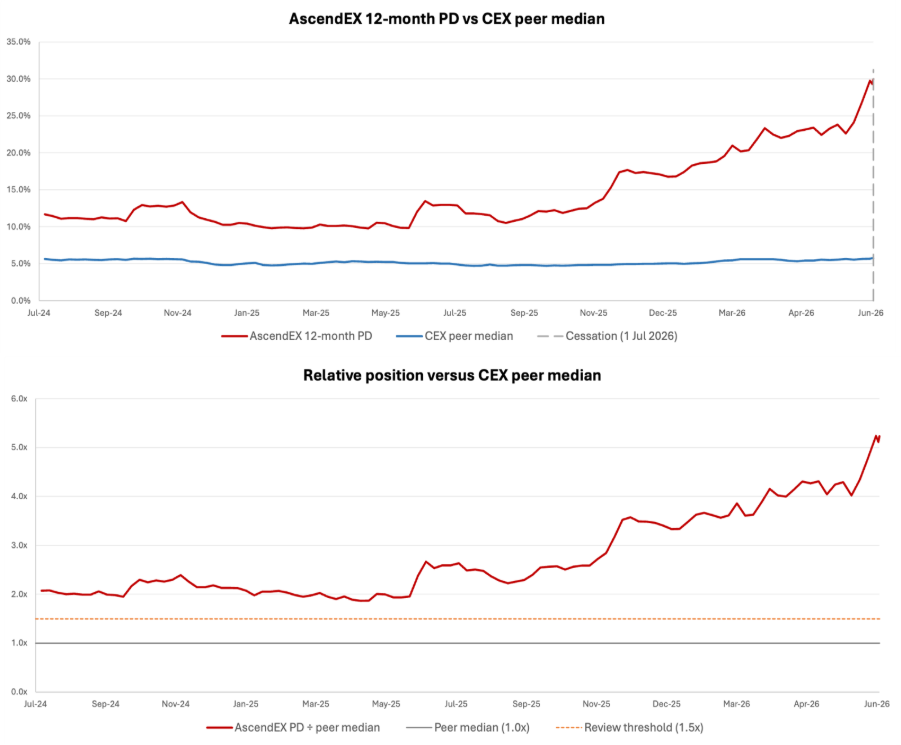
AscendEX ceased operations on 1 July 2026. By then, the Agio Ratings CEX model had flagged it as the highest-risk exchange in our coverage for several months, with a 12-month probability of default (PD) that had climbed to almost five times the peer median. The deterioration was visible from September 2025, well before the closure was announced.
AscendEX was not a marginal venue. It served clients across more than 200 regions,1 offered spot, margin and derivatives trading, and ran daily volume above $1 Billion.2 That scale is what makes the case instructive: a large, active exchange became measurably vulnerable long before it stopped operating, and the signal was there to be read.
The AscendEX case illustrates a broader challenge in digital asset risk management. Most risk managers can spot a market rout; few are equipped to identify the idiosyncratic risks that market volatility blurs. The Agio Ratings CEX model, first launched in 2022 and now in its third iteration, captured the deterioration in AscendEX's default risk from September 2025.
In its closure announcement, AscendEX cited MiCA-related authorisation issues, wider regulatory, financial, and operational pressures, adverse market conditions, and the failure of a strategic transaction expected to provide liquidity.3
There is a straightforward reading of this. MiCA took full effect on 1 July 2026, AscendEX held no authorisation under it, and the exchange ceased operations the same day. On that account, the closure was a regulatory event with a regulatory cause.
That reading explains the timing of the wind-down. It leaves open a separate question: why AscendEX had become unusually vulnerable well before the deadline arrived.
Our data speaks to that question. The model's licence-quality sub-score was broadly static through the period in which the PD deteriorated, so the increase was not a reaction to a newly observed regulatory fact. It was associated with behavioural and balance-related signals, and it was visible from September 2025, roughly ten months before the MiCA deadline. On the evidence, the regulatory deadline coincided with the closure. The vulnerability it exposed had been building for the better part of a year.
AscendEX was already elevated versus peers, but the deterioration became materially more pronounced from September 2025
The series of PDs begins in July 2024 and AscendEX is already above the peer median at that point. However, the series shows a clear worsening phase from September 2025 onward, when the gap versus peers begins to widen more visibly and selected underlying indicators also start to deteriorate.
Figure 1 compares AscendEX's weekly 12-month PD with the median across eligible exchange peers.
AscendEX's Riskiness Was Reflected Across Several Factors
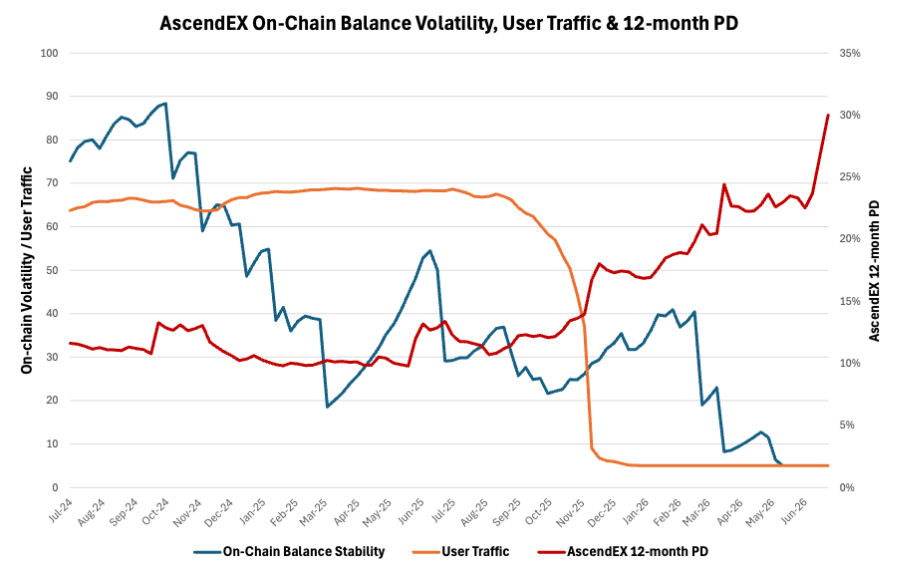
The driver history bears this out. Behind the headline PD, the model tracks a set of sub-scores, and their movements show where the deterioration came from. The behavioural and balance-related signals weakened materially, while the licence-quality sub-score did not.
Figure 2 plots the two clearest movements, balance stability and user traffic. A third driver, trading volatility risk, is discussed below but not charted. The scores are risk indicators, with higher values indicating stronger relative performance. They are shown retrospectively to explain the pattern in the PD, rather than as a claim that each historical score was separately delivered to clients at the time.
The sequence is informative.
The on-chain balance-stability score measures how stable an exchange's observable wallet balances are relative to peers. A falling score means those balances are becoming more erratic through time. The score nearly halved between June and September 2025, before the PD's sustained divergence was established. It weakened further and reached the score floor in May 2026. This is consistent with a deterioration in the stability of observable on-chain balances. It is not proof of an internal liquidity shortfall, but it is the type of signal one would expect to matter if financial resilience were weakening.
Similarly, the model treats user traffic as a proxy for customer engagement. A sustained decline can reduce trading activity and fee income and thus lead to a loss of confidence. The sequence observed in Figure 2 is consistent with such a feedback loop. The score fell precipitously between September and November 2025 and reached its floor by January 2026. That later collapse is consistent with a loss of market engagement, customer activity or confidence after the balance-related signal had already weakened.
A third indicator, trading volatility risk, also deteriorated. Its score dropped by more than 50% between September 2025 and March 2026.
The picture is therefore not one variable “predicting” the closure. It is a sequence in which several independent aspects of the exchange's observable footprint weakened at different times.
Why Single-Signal Frameworks Miss the Sequence
There are many exchange evaluation frameworks that capture useful signals for due diligence. Ours combines consistently observable indicators across scale, activity, volatility, on-chain transaction patterns, user traffic, maturity, regulatory standing, and market conditions, weighted within a defined statistical framework and mapped to a weekly 12-month PD.
The advantage is not that Agio Ratings sees an entirely distinct set of facts. The advantage is that the facts are interpreted consistently: the direction is defined, the weights are explicit, changes are compared with peers, and the result is mapped onto a probability that can be monitored through time.
That distinction is visible in the AscendEX case. A static regulatory assessment could identify an authorisation gap. A liquidity score could assess order-book quality. A proof-of-reserves check could indicate whether wallet information was available. Those are all relevant. The limitation of most frameworks is not what they measure, but that they read each signal in isolation. None, by itself, captures the sequence in which balance stability weakened, traffic later collapsed and the combined PD moved from near-peer levels to almost five times the peer median before operations ceased.
The Lesson for Risk Managers
A practical risk management framework should combine at least three views:
- Absolute risk: what is the current probability of default over a defined horizon?
- Relative risk: how far is the counterparty from comparable peers?
- Direction and drivers: is risk rising, and which observable signals are changing?
AscendEX illustrates why all three matter. The absolute PD became high. The peer multiple showed that this was not simply a market-wide repricing. The driver history showed that the deterioration was multi-dimensional and sequential.
The case also argues for review thresholds based on persistence. AscendEX's first breach of 1.5 times the peer median would not, by itself, prove anything. Four consecutive weekly observations, followed by a widening gap, are a different signal. That is the point at which a risk team can intensify diligence, reduce limits, demand additional information, or reassess exit options, well before a formal cessation notice.
We are the first to acknowledge that one event does not validate an entire methodology. A high-PD exchange can continue operating, and a lower-PD exchange can still experience an operational failure after an idiosyncratic shock. The selected driver histories are explanatory associations, not evidence that the model has identified the legal or accounting cause of a particular wind-down.
We also acknowledge that the risk manager's mandate is not to predict the exact triggers of default; rather, it is to run a disciplined risk management programme that can protect capital efficiently. That requires identifying which counterparties are becoming more vulnerable, quantifying how unusual that vulnerability is, and acting in time and in proportion to the risk.
The AscendEX case shows what that discipline delivers: a counterparty identified as the highest-risk name in coverage, quantified at almost five times the peer median, with a deterioration traceable across balance stability, traffic and volatility roughly ten months before operations ceased. That lead time is what a risk team can act on.
Want to run the CEX model across your current exchange exposures and get a sample that includes PD, peer multiple, and driver history? Reach our team at contact@agioratings.io.
1. Source: CoinMarketCap, accessed 15 July 2026, Link: AscendEX trade volume and market listings
2. Source: CoinGecko, accessed 15 July 2026, Link: AscendEX(BitMax) Statistics: Markets, Trading Volume & Trust Score
3. Source: AscendEX, "Cessation of operations and processing of withdrawals", official status page, 6 July 2026, accessed 16 July 2026, https://ascendex.com/