Executive Summary
- A stablecoin can be fully collateralised and still be one bad week from the threshold. The reserve ratio does not tell you that.
- The reserves behind the ratio matter as much as the ratio itself. When volatile assets back the buffer, moderate price moves destroy most of the cushion.
- Five metrics give the complete picture: reserve ratio, equity buffer trend, sensitivity analysis, volatile asset concentration, and on-chain flows.
- This guide uses Tether (USDT) as the live case study throughout, with real data from Agio's Stablecoin Reserves Modeling (SRM) product.
Why Reserve Ratio Alone Misleads Risk Teams
Most stablecoin risk conversations start and end with the reserve ratio. It is a single number, is easy to read, and it tells you whether the issuer holds enough assets to cover every token in circulation. The problem is what it omits.
The ratio confirms coverage, but it says nothing about the composition of the assets backing the coin. The risk profile of T-bills and Bitcoin is quite different — a point explored in depth in Agio's proof of reserves explainer. A stablecoin can be fully collateralised and still sit one drawdown from the 1.000x threshold when the buffer itself is made of volatile assets.
Reserve ratio is necessary. It is not sufficient. The five metrics that follow establish the number, question it, stress test it, explain why it's fragile, and monitor it in real time.
Tether (USDT) is the world's largest stablecoin by circulating supply, with $186.58B in tokens outstanding as of June 2026. It is used throughout this guide as the live case study because Agio's Stablecoin Reserves Modeling (SRM) product provides daily estimates of its reserve position — data that makes each of the five metrics concrete rather than theoretical.
Metric 1: Reserve Ratio
Definition: The reserve ratio is total assets divided by total liabilities — the baseline measure of whether a stablecoin issuer holds enough assets to cover every token in circulation.
The reserve ratio divides total assets by total liabilities, with $192.9B in assets against $186.58B in circulating USDT. The number confirms over-collateralisation and is the first figure any risk team checks.

That ratio fell -0.69% since the March 31 attestation even though total assets grew +0.58%. Liabilities expanded faster, up +1.28%, as new USDT issuance outpaced reserve growth and compressed the cushion.
A static snapshot hides this kind of directional drift. The next four metrics exist to surface what a single ratio cannot.
Metric 2: Equity Buffer Trend
Definition: The equity buffer is the dollar value of assets held above the 1.000x coverage threshold — the absolute cushion between an issuer and insolvency, tracked over time to reveal direction.
The equity buffer is the dollar cushion sitting above the 1.000x threshold. Today that buffer reads $6.31B.
Level alone hides the story. The buffer peaked near $12B in January 2026 and has fallen $5.7B in roughly five months, down 16.44% since the last attestation. A static snapshot would never surface that trajectory.
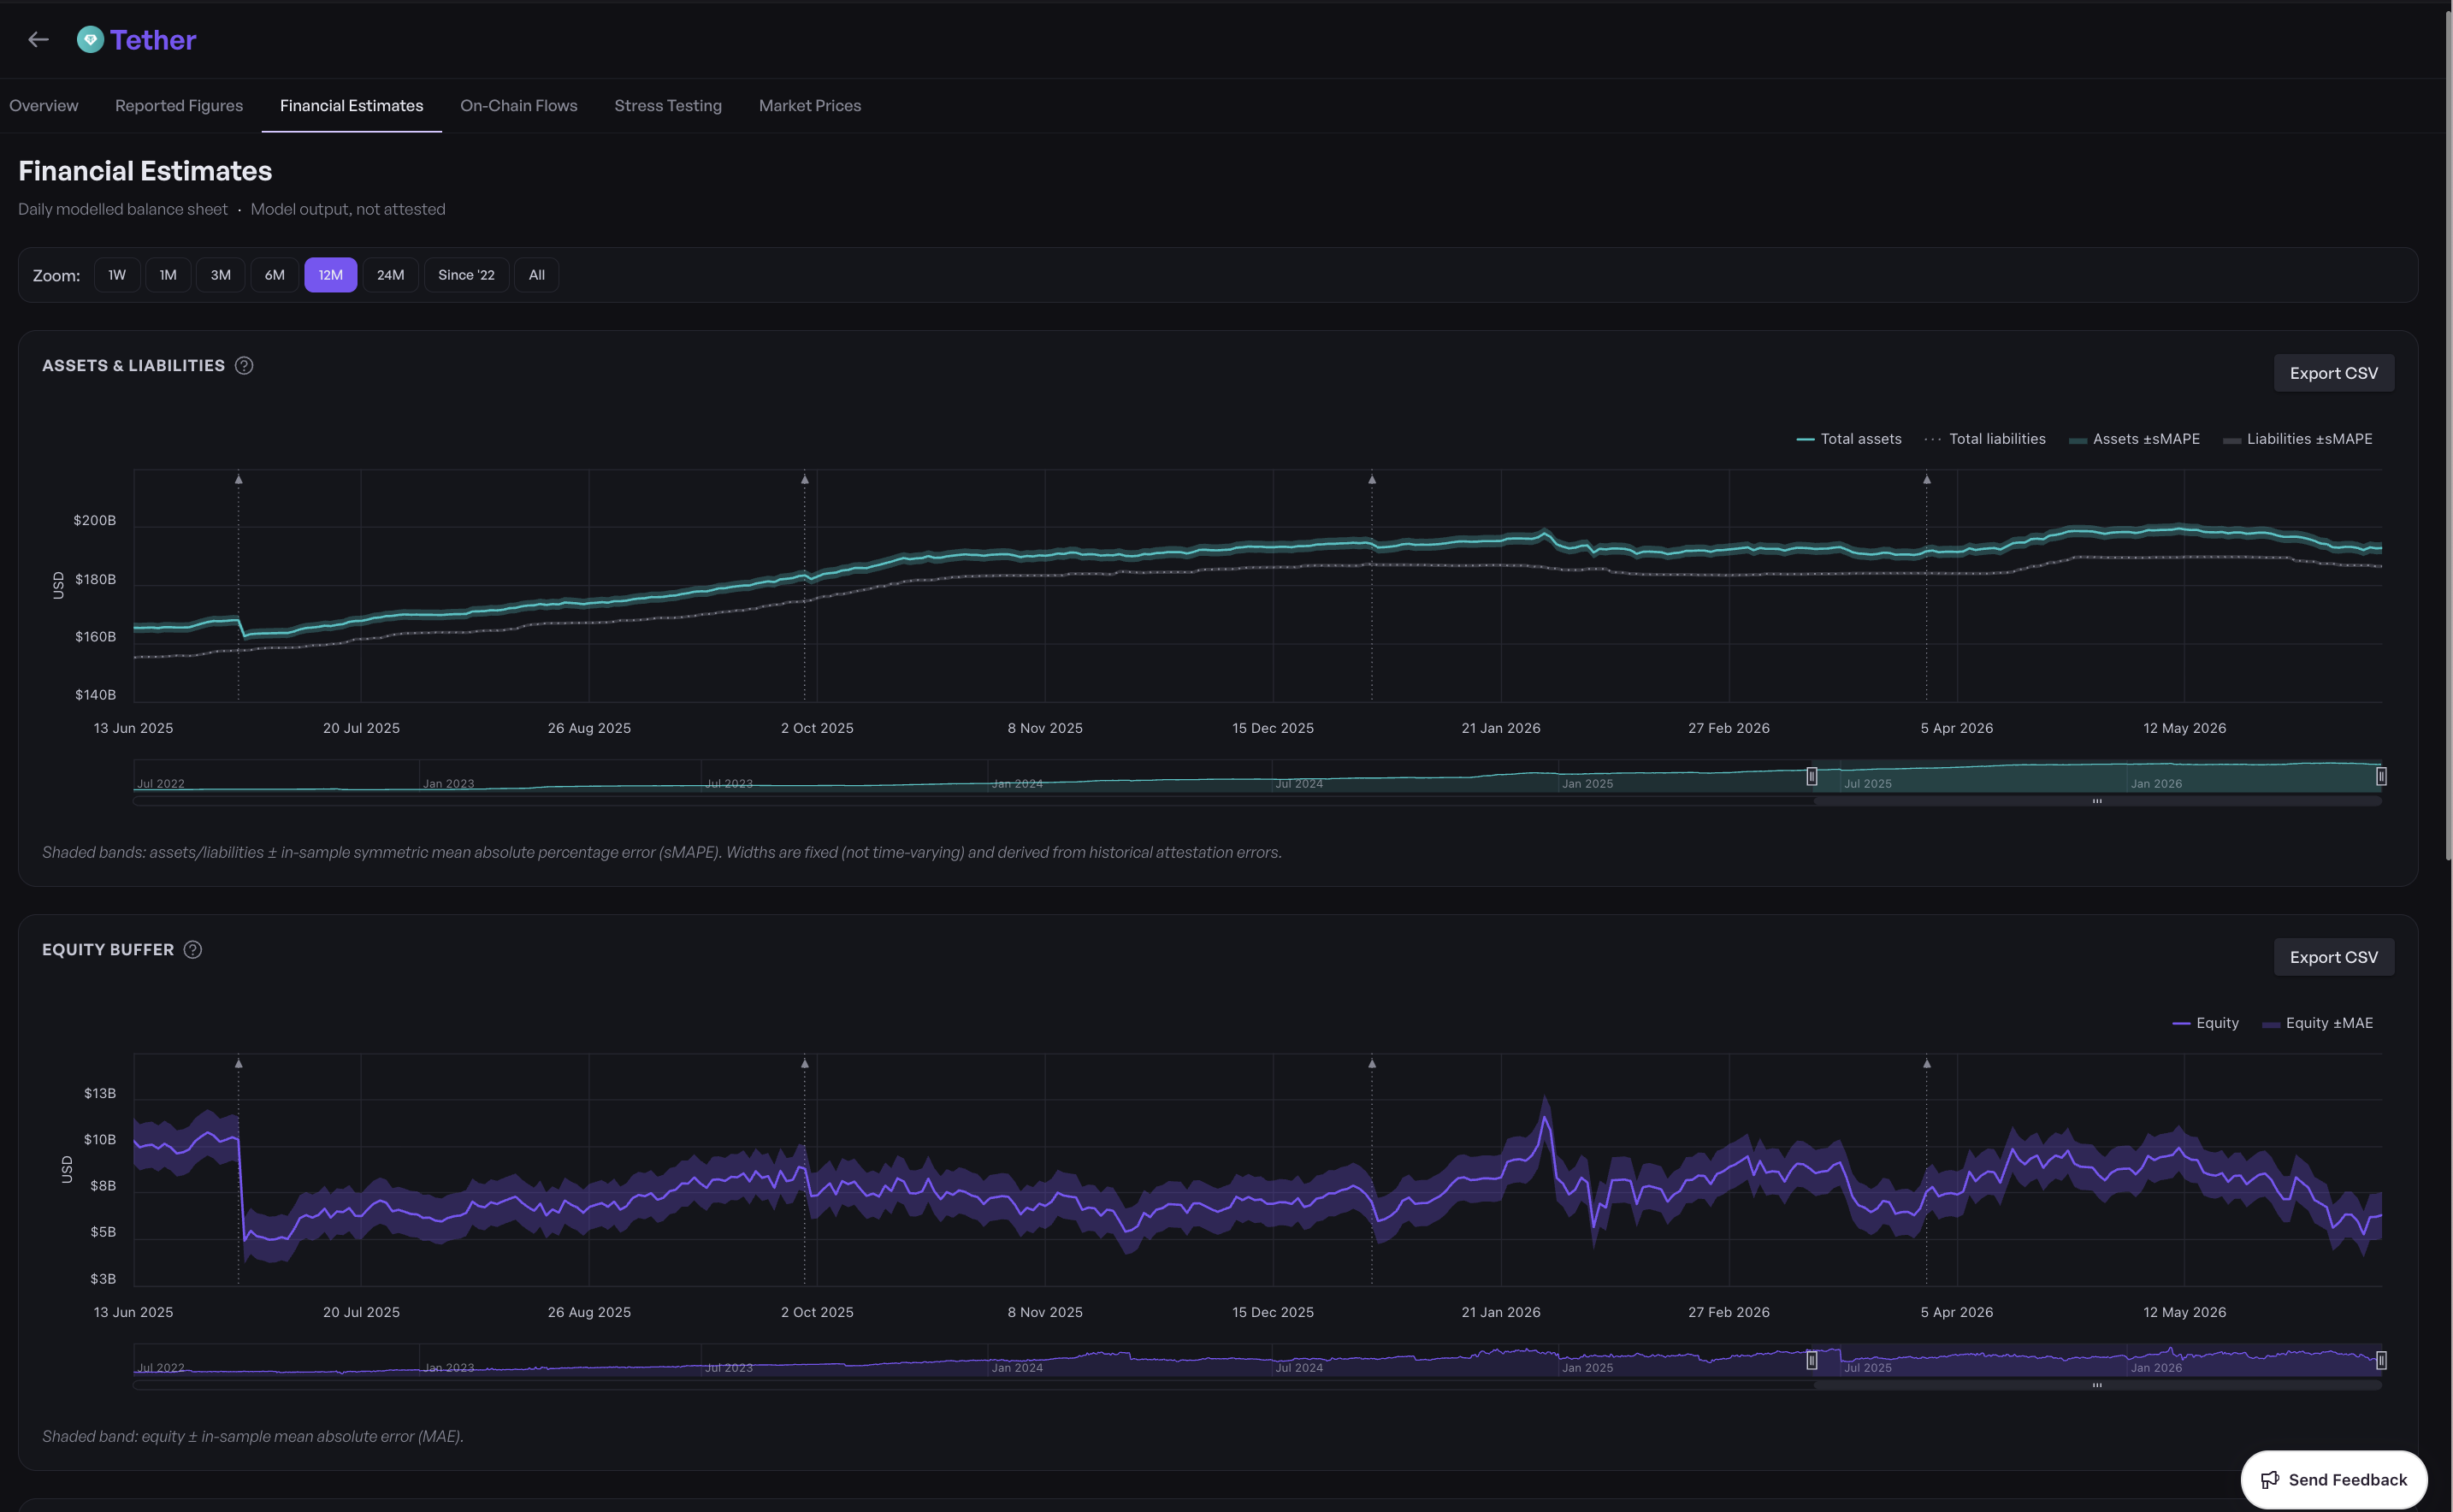
Two forces drive the erosion. Volatile asset prices fell on one side, while T-bill yields compressed from roughly 5.25% to 3.25-3.50% on the 63.5% of reserves held in T-bills. The income squeeze and the price squeeze hit the same buffer at once.
The entire $5.7B compression happened inside a single inter-attestation window. Without daily modelling, a risk team reading the March 31 figures would see none of it until the next quarterly report lands.
Metric 3: Sensitivity Analysis
Definition: Sensitivity analysis applies simultaneous price shocks to a stablecoin's volatile reserve assets and measures the resulting impact on the reserve ratio and equity buffer — the only metric that tells you whether the buffer is real under pressure.
Sensitivity analysis applies simultaneous price shocks. Run a moderate scenario against Tether's reserves. A 30% drop in Bitcoin and a 20% drop in gold cuts the equity buffer from $6.31B to $720.79M, an 88.6% loss, and pulls the ratio from 1.0338x to 1.0039x.
Neither shock is extreme. Within this 12-month window, Bitcoin fell from roughly $130K in late 2025 to $55K by February 2026, a drawdown well past 30%. Gold swung from $3,000 to over $5,000 and back. The stress moves Agio applies sit inside observed history, not a tail event.

The full matrix shows how little additional pressure crosses the 1.000x line.
A 40% gold decline alone, with Bitcoin flat, breaks the threshold at 0.9954x. Combine a 20% gold move with a 40% Bitcoin move and reserves fall to 0.9931x. The green-to-red boundary runs through the middle of moves Tether's assets have already made this year.
A ratio of 1.0039x means $720M stands between full collateralisation and a deficit on $186.58B of circulating supply. One bad session in gold or Bitcoin closes that gap. The 1.0338x headline reads as comfortable, but the stressed ratio shows reserves one trading day from the insolvency line.
This is the metric that separates a coverage number from a risk assessment.

Metric 4: Volatile Asset Concentration
Definition: Volatile asset concentration measures the proportion of the equity buffer backed by price-volatile assets, expressed as (Gold + BTC) / Equity — the structural metric that explains why sensitivity analysis produces such severe results.
Volatile asset concentration measures how much of the equity buffer sits in price-volatile assets. Tether's ratio now runs above 200%, spiking toward 400% across 2025 and 2026.
In mid-2022 this ratio sat near zero. Gold has climbed from 3.2% to 10.3% of total assets, while BTC held between 3.5% and 5.5%. The combined volatile holdings now exceed twice the entire equity cushion.
This ratio explains the severity of the stress test result. When volatile assets exceed 2x the buffer, a moderate move in BTC or gold wipes out most of the cushion before it touches the stable T-bill base. The -30% BTC / -20% Gold scenario destroying 88.6% of equity is the direct consequence of a buffer that is, in substance, the volatile assets themselves.
A 1.0338x reserve ratio and a buffer backed almost entirely by volatile assets coexist without contradiction. Coverage looks healthy on the surface while the composition makes that coverage fragile.

Metric 5: On-Chain Issuance and Redemption Flows
Definition: On-chain issuance and redemption flows track daily token minting versus burning on the blockchain — the real-time leading indicator of demand pressure that updates faster than any financial statement or attestation.
On-chain flows track daily USDT issuances against redemptions. The four prior metrics describe the reserves. This one describes the pressure on them.
Tether has issued $19.93B and redeemed $17.65B since the March 31 attestation, a net issuance of +$2.28B. Two-way flow stays healthy, with daily volumes in the $0-$5B range and no sustained imbalance through June 2026. Demand for USDT is expanding, not draining.

Watch this metric first when conditions deteriorate. Sustained net redemption pressure forces Tether to liquidate reserve assets, and that selling precedes the balance sheet damage you would otherwise see a quarter later. On-chain data updates by the block, faster than any attestation or financial statement.
A redemption wave colliding with the volatile-asset concentration from Metric 4 is the scenario that turns a 1.0039x stressed ratio into a breach. Flows give you the earliest warning that the scenario is starting.
The Five Metrics Together: A Monitoring Framework
Read in order, the five metrics build one argument about Tether. Each answers a question the previous one leaves open.
| Metric | What it measures | Tether reading (June 2026) |
|---|---|---|
| Reserve ratio | Coverage of liabilities | 1.0338x |
| Equity buffer trend | Direction of the cushion | $6.31B, -16.44% since attestation |
| Sensitivity analysis | Buffer survival under stress | -30% BTC / -20% Gold wipes 88.6%, ratio 1.0039x |
| Volatile asset concentration | Buffer exposure to price moves | (Gold+BTC)/Equity above 200% |
| On-chain flows | Real-time redemption pressure | +$2.28B net issuance, healthy two-way flow |
No single reading clears Tether. The ratio establishes coverage, the trend questions it, the stress test breaks it, concentration explains why, and flows tell you when to act. Tracking all five at once requires daily data, not quarterly attestations. For broader context on how institutions measure stablecoin default and liquidity risk, see Stablecoin Risk: How Institutions Measure Default, Liquidity, and Contagion.
How Agio's SRM Tracks All Five Metrics Continuously
Tether's quarterly attestations leave a 75-day blind spot. The reserve ratio fell -0.69% and the equity buffer dropped 16.44% inside that gap, invisible to anyone reading the last attested figures. Agio's SRM closes the gap with daily model estimates and error bands on every figure.
Each metric maps to a dedicated view. The ratio dashboard tracks coverage daily, the equity buffer chart surfaces the trend, the stress scenario matrix runs the BTC and gold drawdowns, the concentration chart plots (Gold+BTC)/Equity, and the on-chain flow monitor reads issuance against redemption in real time. The model resolves all five into a single 0.69% 1-year probability of default.
Risk officers at trading firms, banks, and insurers who need continuous monitoring rather than quarterly snapshots can request a demo.
FAQs
Are stablecoin reserves safe?
Full collateralisation does not equal safety. Tether's 1.0338x ratio coexists with an equity buffer backed almost entirely by volatile assets. Composition matters as much as coverage. For a full breakdown of Tether's credit risk, see Agio's Credit Risk Assessment: Tether (USDT Issuer).
What is sensitivity analysis in the context of stablecoin reserves?
Sensitivity analysis applies simultaneous price shocks to volatile reserve assets and measures the impact on the ratio and equity buffer. A -30% BTC and -20% Gold shock leaves Tether at $720M equity and a 1.0039x ratio. It reveals fragility a static snapshot hides.
How often does Tether report its reserves?
Tether attests quarterly, leaving a 75-day gap as of June 2026. Agio's SRM fills that window with daily model estimates.
How does Agio's SRM track stablecoin reserve risk?
SRM maps each metric to a dedicated view. You get a ratio dashboard, equity buffer trend, stress scenario matrix, concentration chart, and on-chain flow monitor.